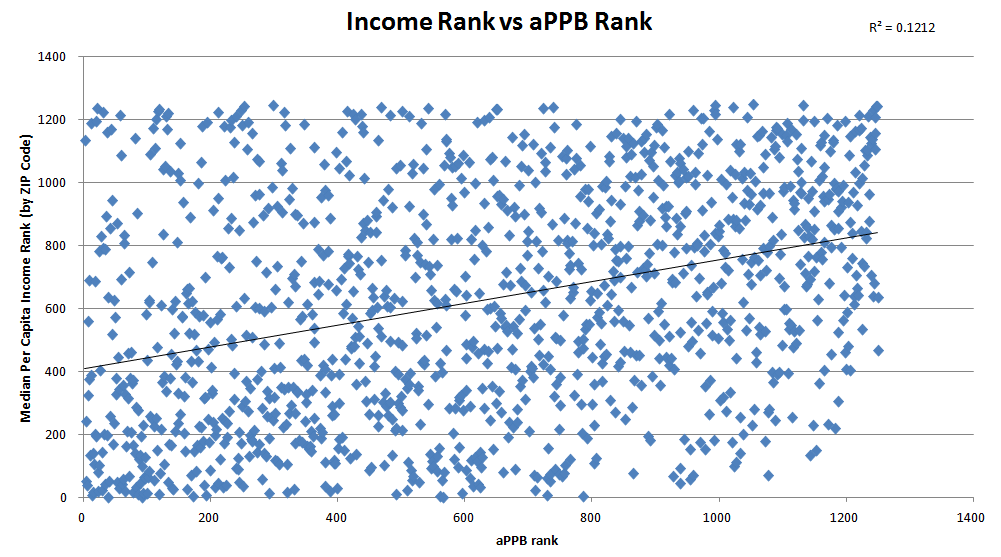
Quiz Bowl Skill and Income
So I just finished looking at those ZIP codes people helped put together for me and compared it with the median household income of those ZIP codes.
wow a chart
I talk about it a little bit over there, but the Pearson's r is 0.3482, which indicates "a moderate positive relationship" between a ZIP code's median household income and the aPPB of a school located there.
wow a chart
I talk about it a little bit over there, but the Pearson's r is 0.3482, which indicates "a moderate positive relationship" between a ZIP code's median household income and the aPPB of a school located there.
Fred Morlan
University of Kentucky CoP, 2017
International Quiz Bowl Tournaments, CEO, co-owner
former PACE member, president, etc.
former hsqbrank manager, former NAQT writer & subject editor, former hsqb Administrator/Chief Administrator
University of Kentucky CoP, 2017
International Quiz Bowl Tournaments, CEO, co-owner
former PACE member, president, etc.
former hsqbrank manager, former NAQT writer & subject editor, former hsqb Administrator/Chief Administrator
- ryanrosenberg
- Auron
- Posts: 1891
- Joined: Thu May 05, 2011 5:48 pm
- Location: Palo Alto, California
Re: Quiz Bowl Skill and Income
One the reasons using ZIP codes doesn't work well is because of magnet schools; for example, NCSSM is ranked #872 in income because it's located in downtown Durham, despite drawing students from all around North Carolina, most from more affluent areas. In a reverse situation, Hunter is on the Upper East Side of Manhattan and thus likely appears to have a higher average income than the student body actually has.
Ryan Rosenberg
North Carolina '16
NYU '26 (ideally)
ACF
North Carolina '16
NYU '26 (ideally)
ACF
-
- Lulu
- Posts: 76
- Joined: Tue Jul 15, 2014 11:30 am
- Location: Wilmington, DE
Re: Quiz Bowl Skill and Income
Interesting thought, and intuitively it "feels right" that income and quiz bowl success would be correlated, since income and almost all positive academic outcomes are generally correlated.
Median income by ZIP code, however, is going to be problematic, for reasons already brought up:
1) The ZIP code of the school is not necessarily the ZIP code of the student body
2) Magnet schools, or even schools with a substantial amount of "school choice" are going to distort this
3) Private schools will likely distort this
4) Quiz bowl is probably already drawing students from the right tail of the academic distribution, and even HS in relatively poor districts will have at least a few kids in that right tail
5) Related to #4, you don't need an aggregate performance from the whole student body to have a decent quiz bowl team; a handful of good kids will suffice
We'd need to add other variables to the regression to get a better model, but:
1) I'm not sure what those variables would be; and
2) It will be damned hard to find additional variables that are truly independent of income (in multiple regression analysis, the underlying assumption is that the independent variables are, well, independent
But a nice start!
Patrick Matthews
University of Pennsylvania 1989-94
NAQT Member Emeritus and co-founder
I do not speak for NAQT in any way, shape, or form.
University of Pennsylvania 1989-94
NAQT Member Emeritus and co-founder
I do not speak for NAQT in any way, shape, or form.
Re: Quiz Bowl Skill and Income
Yep!The Predictable Consequences wrote:One the reasons using ZIP codes doesn't work well is because of magnet schools; for example, NCSSM is ranked #872 in income because it's located in downtown Durham, despite drawing students from all around North Carolina, most from more affluent areas. In a reverse situation, Hunter is on the Upper East Side of Manhattan and thus likely appears to have a higher average income than the student body actually has.
Fred Morlan
University of Kentucky CoP, 2017
International Quiz Bowl Tournaments, CEO, co-owner
former PACE member, president, etc.
former hsqbrank manager, former NAQT writer & subject editor, former hsqb Administrator/Chief Administrator
University of Kentucky CoP, 2017
International Quiz Bowl Tournaments, CEO, co-owner
former PACE member, president, etc.
former hsqbrank manager, former NAQT writer & subject editor, former hsqb Administrator/Chief Administrator
- Stained Diviner
- Auron
- Posts: 5089
- Joined: Sun Jun 13, 2004 6:08 am
- Location: Chicagoland
- Contact:
Re: Quiz Bowl Skill and Income
Keep in mind that we are already seeing a correlation here, and more accurate measurement would likely increase the correlation.
Here are the teams with the largest residuals in the data. Keep in mind that I am using the rankings here, as Fred did, though it probably would make more sense to use the raw data of aPPB vs income.
1. Carbondale
2. duPont Manual
3. UChicago Lab
4. Winchester Thurston
5. Auburn
6. Hume Fogg
7. Maggie Walker
8. Pensacola
9. Jesuit
10. Manheim Township
- ryanrosenberg
- Auron
- Posts: 1891
- Joined: Thu May 05, 2011 5:48 pm
- Location: Palo Alto, California
Re: Quiz Bowl Skill and Income
Quick eyeballing: Manual and Maggie Walker are magnet schools, Jesuit is private, and UChicago Lab, despite being on the South Side, draws much of its student body from the children of UChicago professors. Carbondale is also a university town, although I don't know how prominent SIU is.Yellow-throated Honeyeater wrote: Here are the teams with the largest residuals in the data. Keep in mind that I am using the rankings here, as Fred did, though it probably would make more sense to use the raw data of aPPB vs income.
1. Carbondale
2. duPont Manual
3. UChicago Lab
4. Winchester Thurston
5. Auburn
6. Hume Fogg
7. Maggie Walker
8. Pensacola
9. Jesuit
10. Manheim Township
To control for the ability of one or two students to lift a whole program, it might make sense to look at 3-5 year averages of aPPB rank (or, if aPPBs are supposed to be standardized from year to year, just average aPPB rank).
Ryan Rosenberg
North Carolina '16
NYU '26 (ideally)
ACF
North Carolina '16
NYU '26 (ideally)
ACF
Re: Quiz Bowl Skill and Income
I previously took a non-rigorous, nonsystematic look at rankings vs. income with local universities factored in; it seems that the universities part plays at least as big a role, which is hardly surprising.
Jacob R., ex-Chicago
- Stained Diviner
- Auron
- Posts: 5089
- Joined: Sun Jun 13, 2004 6:08 am
- Location: Chicagoland
- Contact:
Re: Quiz Bowl Skill and Income
To follow up on my previous post, if you look at the raw data rather than the rankings, you get a Pearson's r of .352, which isn't much different. A ranking of the top teams by residual in that case, however, has more in common with a top ten ranking of aPPB alone than the one based on rankings does. Here it is:
1. LASA
2. Maggie Walker
3. Carbondale
4. Auburn
5. duPont Manual
6. IMSA
7. Dorman
8. Western Albemarle
9. Oak Ridge
10. Northmont
1. LASA
2. Maggie Walker
3. Carbondale
4. Auburn
5. duPont Manual
6. IMSA
7. Dorman
8. Western Albemarle
9. Oak Ridge
10. Northmont
Re: Quiz Bowl Skill and Income
FYI, median household income is available for Canadian census tracts. It is based on the census of May 16, 2006, so inflation and the difference between the CAD and USD would need to be taken into account.
The raw numbers for some Canadian teams:
Almonte (K0A1A0*): 67114
Assumption (L7N3P1): 47386
Bell (K2H6K1): 80575
Bellerose (T8N6N4): 110423
Centennial CVI (N1G1S9): 73422
Colonel By (K1J7N4): 80204
Glebe (K1S2C9): 92127
John F Ross (N1E4H1): 57592
Lisgar (K2P0B9): 56690
Merivale (K2G1E2**): 57103
Old Scona (T6E2H5): 39461 ***
Sir Winston Churchill (L2T2N1): 55060
Waterloo CI (N2L3P2): 17446 ***
Webber (T3H4A8): 117971
Westmount (L9C4B1): 47059
* Almonte is in a rural census division that covers a wide area
** I corrected the income info for a misleading postal code (Merivale was lumped with a suburb 10 km away; other schools seem fine)
*** Old Scona and Waterloo CI are essentially in university student neighbourhoods (<20% couples)
Like other people have said, a lot of students travel around to schools outside their neighbourhood and don’t reflect the income data.
Ben Smith
Ottawa '08 & '10
Ottawa '08 & '10
Re: Quiz Bowl Skill and Income
And assuming Auburn is the one in Rockford, Illinois, for our purposes it is effectively a citywide magnet school. (The school has a portion called the Academy, which is the city magnet program, and the quizbowl team is in practice entirely drawn from the Academy, though that is not a rule.)The Predictable Consequences wrote:Quick eyeballing: Manual and Maggie Walker are magnet schools, Jesuit is private, and UChicago Lab, despite being on the South Side, draws much of its student body from the children of UChicago professors. Carbondale is also a university town, although I don't know how prominent SIU is.Yellow-throated Honeyeater wrote: Here are the teams with the largest residuals in the data. Keep in mind that I am using the rankings here, as Fred did, though it probably would make more sense to use the raw data of aPPB vs income.
1. Carbondale
2. duPont Manual
3. UChicago Lab
4. Winchester Thurston
5. Auburn
6. Hume Fogg
7. Maggie Walker
8. Pensacola
9. Jesuit
10. Manheim Township
To control for the ability of one or two students to lift a whole program, it might make sense to look at 3-5 year averages of aPPB rank (or, if aPPBs are supposed to be standardized from year to year, just average aPPB rank).
Jonah Greenthal
National Academic Quiz Tournaments
Re: Quiz Bowl Skill and Income
This is especially true of Colonel By and Lisgar; I don't know a single member of my team that lives within 15 km (10 miles) of my school.bsmith wrote: Like other people have said, a lot of students travel around to schools outside their neighbourhood and don’t reflect the income data.
Fred, are there any future plans for similar statistical analyses like this, with or without the ZIP codes? If so, I look forward to them; thanks for doing this! If you need help collecting data, given the rate at which the HSQB community collected all the ZIP codes, we're eager to help if it leads to more interesting studies like this.
EDIT: changed from "within 15 km (10 miles) of the school" to "within 15 km (10 miles) of my school" for clarity
Last edited by Theodore on Tue Jul 15, 2014 4:43 pm, edited 1 time in total.
Ted (Ze Feng) Gan
The Pennsylvania State University, 2025
The Pennsylvania State University, 2021
Carleton University, 2019
Colonel By Secondary School, 2015
Former Executive Member of the Ontario Quizbowl Association (ONQBA), 2015-16
Former NAQT Writer, 2013-2016
The Pennsylvania State University, 2025
The Pennsylvania State University, 2021
Carleton University, 2019
Colonel By Secondary School, 2015
Former Executive Member of the Ontario Quizbowl Association (ONQBA), 2015-16
Former NAQT Writer, 2013-2016
Re: Quiz Bowl Skill and Income
What if you used income data by county rather than by ZIP code? Only a very few schools draw from multiple counties.Theodore wrote:I don't know a single member of my team that lives within 15 km (10 miles) of the school.
Kyle Haddad-Fonda
Harvard '09
Oxford '13
Harvard '09
Oxford '13
- Stained Diviner
- Auron
- Posts: 5089
- Joined: Sun Jun 13, 2004 6:08 am
- Location: Chicagoland
- Contact:
Re: Quiz Bowl Skill and Income
That wouldn't improve the data in major metropolitian areas, where a lot of teams are from, because counties are so big and diverse. Knowing that somebody is from Cook County or Los Angeles County tells you pretty close to nothing about income.Kyle wrote:What if you used income data by county rather than by ZIP code? Only a very few schools draw from multiple counties.Theodore wrote:I don't know a single member of my team that lives within 15 km (10 miles) of the school.
Re: Quiz Bowl Skill and Income
I mentioned on the original post wanting to do it by school district.Kyle wrote:What if you used income data by county rather than by ZIP code? Only a very few schools draw from multiple counties.Theodore wrote:I don't know a single member of my team that lives within 15 km (10 miles) of the school.
Fred Morlan
University of Kentucky CoP, 2017
International Quiz Bowl Tournaments, CEO, co-owner
former PACE member, president, etc.
former hsqbrank manager, former NAQT writer & subject editor, former hsqb Administrator/Chief Administrator
University of Kentucky CoP, 2017
International Quiz Bowl Tournaments, CEO, co-owner
former PACE member, president, etc.
former hsqbrank manager, former NAQT writer & subject editor, former hsqb Administrator/Chief Administrator
Re: Quiz Bowl Skill and Income
But some are from private schools. You could do it by school district if you threw out the private schools.Dr. Loki Skylizard, Thoracic Surgeon wrote:I mentioned on the original post wanting to do it by school district.Kyle wrote:What if you used income data by county rather than by ZIP code? Only a very few schools draw from multiple counties.Theodore wrote:I don't know a single member of my team that lives within 15 km (10 miles) of the school.
Kyle Haddad-Fonda
Harvard '09
Oxford '13
Harvard '09
Oxford '13
Re: Quiz Bowl Skill and Income
The Predictable Consequences wrote:Quick eyeballing: Manual and Maggie Walker are magnet schools, Jesuit is private, and UChicago Lab, despite being on the South Side, draws much of its student body from the children of UChicago professors. Carbondale is also a university town, although I don't know how prominent SIU is.Yellow-throated Honeyeater wrote: Here are the teams with the largest residuals in the data. Keep in mind that I am using the rankings here, as Fred did, though it probably would make more sense to use the raw data of aPPB vs income.
1. Carbondale
2. duPont Manual
3. UChicago Lab
4. Winchester Thurston
5. Auburn
6. Hume Fogg
7. Maggie Walker
8. Pensacola
9. Jesuit
10. Manheim Township
To control for the ability of one or two students to lift a whole program, it might make sense to look at 3-5 year averages of aPPB rank (or, if aPPBs are supposed to be standardized from year to year, just average aPPB rank).
Winchester Thurston is private, as well. Manheim Township is actually in a relatively high-income area, but the zip code for its mailing address doesn't actually correspond to a geographical area and is used almost exclusively by the local retirement community, which skews things a bit. (The school is physically located in 17601).
Andrew Nadig
Mannhiem Mannheim Manheim Township, 2005-11
Carnegie Mellon University, 2011-15
- Sniper, No Sniping!
- Tidus
- Posts: 706
- Joined: Fri Nov 26, 2010 12:25 pm
- Location: Pickerington, OH
Re: Quiz Bowl Skill and Income
I wonder how many of these public schools have enrollment policies that allow students that do not physically live within the school district to attend said school anyway. That's a thing in Ohio, along with large city school districts that allow intra-district enrollment to any non-selective admissions school even if its not the closest school to you. That may skew some numbers.
I'm not sure if income is necessarily the best indicator, certainly there's connection between the top teams and the "places that got dough", but I'm not sure if that's a causation for many of the middle teams. I'm not sure if this as easily accessible, (btw really neat that you did this, Fred) but perhaps if it was possible to determine a percentage of college graduates per zip code it could be even more telling about the value of education and an inclination towards academic extracurricular excellence. One of the public schools I read for at an event averaged ~21ppb on an A-set despite never playing quiz bowl outside of their league before. While that area doesn't have an astonishingly high income, they have a good academic reputation and apparently don't face as many socioeconomic challenges on the whole as other schools and communities in their county do.
I don't think money directly translates into quiz bowl skill, but growing up in a strong community I'd say has an effect.
Thomas Moore
Lancaster Fisher Catholic HS c/o 2014
Ohio Wesleyan University c/o 2018
Lancaster Fisher Catholic HS c/o 2014
Ohio Wesleyan University c/o 2018
-
- Auron
- Posts: 2248
- Joined: Sat Jan 10, 2009 1:08 am
- Location: Kentucky
Re: Quiz Bowl Skill and Income
The best way to measure the socioeconomic status of a student body is in fact not the income of a school's zip code, but the percentage of students who are eligible for free and reduced school lunch. This is an actual data point that is directly tied to the income demographics of a student body, and the information is publicly available by school. I'll throw out one particular piece of information from the data I've looked at: the three most prominent quizbowl playing teams in Jefferson County (Louisville) are DuPont Manual, Ballard, and Eastern. The Free/Reduced percentage for those three schools are 20%, 33%, and 30%, but the percentage for the school district as a whole is 66%.
Nicholas C
KQBA member
KQBA member
Re: Quiz Bowl Skill and Income
I'll try this next, then.NickConderWKU wrote:The best way to measure the socioeconomic status of a student body is in fact not the income of a school's zip code, but the percentage of students who are eligible for free and reduced school lunch. This is an actual data point that is directly tied to the income demographics of a student body, and the information is publicly available by school. I'll throw out one particular piece of information from the data I've looked at: the three most prominent quizbowl playing teams in Jefferson County (Louisville) are DuPont Manual, Ballard, and Eastern. The Free/Reduced percentage for those three schools are 20%, 33%, and 30%, but the percentage for the school district as a whole is 66%.
Fred Morlan
University of Kentucky CoP, 2017
International Quiz Bowl Tournaments, CEO, co-owner
former PACE member, president, etc.
former hsqbrank manager, former NAQT writer & subject editor, former hsqb Administrator/Chief Administrator
University of Kentucky CoP, 2017
International Quiz Bowl Tournaments, CEO, co-owner
former PACE member, president, etc.
former hsqbrank manager, former NAQT writer & subject editor, former hsqb Administrator/Chief Administrator